- Trading
- Trading
- Markets
- Markets
- Products
- Forex
- Commodities
- Metals
- Indices Trading
- Share CFDs Trading
- Cryptocurrency CFDs
- Treasury CFDs
- ETF CFDs Trading
- Accounts
- Accounts
- Compare our accounts
- Open account
- Try free demo
- GO Markets Social
- Platforms & tools
- Platforms & tools
- Platforms
- Platforms
- Platforms overview
- MetaTrader 4
- MetaTrader 5
- Mobile Trading Platforms
- Premium trading tools
- Premium trading tools
- Tools overview
- VPS
- Genesis
- Education
- Education
- Resources
- Resources
- News & Analysis
- Education Hub
- Economic Calendar
- Earnings announcements
- Courses
- Courses
- Introduction to forex
- First steps in forex
- Next steps in forex
- Help & support
- Help & support
- About
- About
- About GO Markets.
- Our awards
- Sponsorships
- Client support
- Client support
- Contact us
- FAQs
- Quick support
- Holiday trading hours
- Fraud and scam awareness
- Legal documents
- Trading
- Trading
- Markets
- Markets
- Products
- Forex
- Commodities
- Metals
- Indices Trading
- Share CFDs Trading
- Cryptocurrency CFDs
- Treasury CFDs
- ETF CFDs Trading
- Accounts
- Accounts
- Compare our accounts
- Open account
- Try free demo
- GO Markets Social
- Platforms & tools
- Platforms & tools
- Platforms
- Platforms
- Platforms overview
- MetaTrader 4
- MetaTrader 5
- Mobile Trading Platforms
- Premium trading tools
- Premium trading tools
- Tools overview
- VPS
- Genesis
- Education
- Education
- Resources
- Resources
- News & Analysis
- Education Hub
- Economic Calendar
- Earnings announcements
- Courses
- Courses
- Introduction to forex
- First steps in forex
- Next steps in forex
- Help & support
- Help & support
- About
- About
- About GO Markets.
- Our awards
- Sponsorships
- Client support
- Client support
- Contact us
- FAQs
- Quick support
- Holiday trading hours
- Fraud and scam awareness
- Legal documents
- Home
- News & Analysis
- Oil, Metals, Soft Commodities
- Gold Making Waves – Where Will Price Settle?
- Home
- News & Analysis
- Oil, Metals, Soft Commodities
- Gold Making Waves – Where Will Price Settle?
 News & AnalysisNews & Analysis
Creating New Monthly Highs
Yesterday gold reached a three-month high of $1,239.68 which, as we head into the final quarter of 2018, is once again stirring up price speculation and talk of a change in directional bias. While the fundamental aspects appear to be related to hiccups in global stock markets, we’ll focus on the technicals for clues as to how these moves might pan out in the medium to long-term.
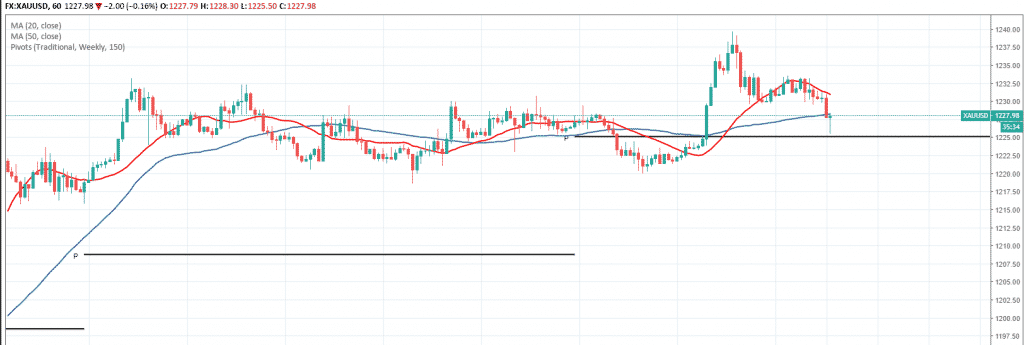
Before we examine charts on the daily timeframes, I want to highlight something interesting on the hourly which is unfolding at the time of writing. Looking at the chart below, notice that price action is finding short-term support around the current weekly pivot around the 1225.00 level. You can also see this predominantly sideways pattern which we will discuss further, prompting many analysts to suggest this price region as a sticking point for the metal.
XAUUSD Hourly – Candlestick Chart

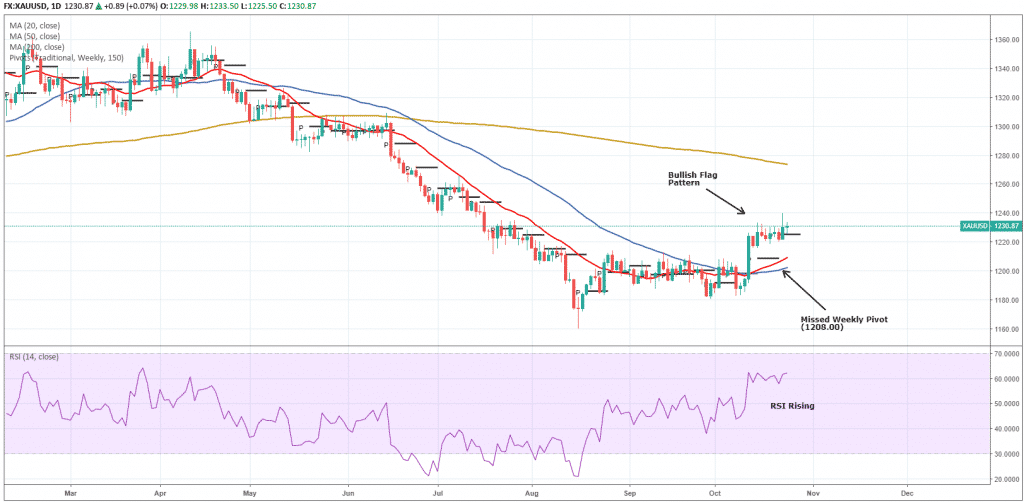
On to the daily chart below, one thing that I am looking for here is some validation for a shift towards a more bullish sentiment, and even from a quick glance, evidence for this scenario is thin on the ground and limited at best.
First up, price action is still trading well below the 200-day moving average (gold line) which suggests the longer-term trend remains bearish. Next, we can see the formation of a bullish flag which initially sparked my interest yesterday, but now looking more like a false breakout with the price rejecting those levels above 1230.00. Of course, the potential is still there for this pattern to develop further. It would be wise to remain cautious though.
XAUUSD Daily – Candlestick Chart
The last two aspects of this chart worth noting are that the current RSI (Relative Strength Index) is showing signs of heating up again, pushing up towards those overbought levels seen around the high. We also have a missed weekly pivot at the 1208.00 level which I think may present the next best support level in the short-term. Both of these elements are arguably bearish for gold.
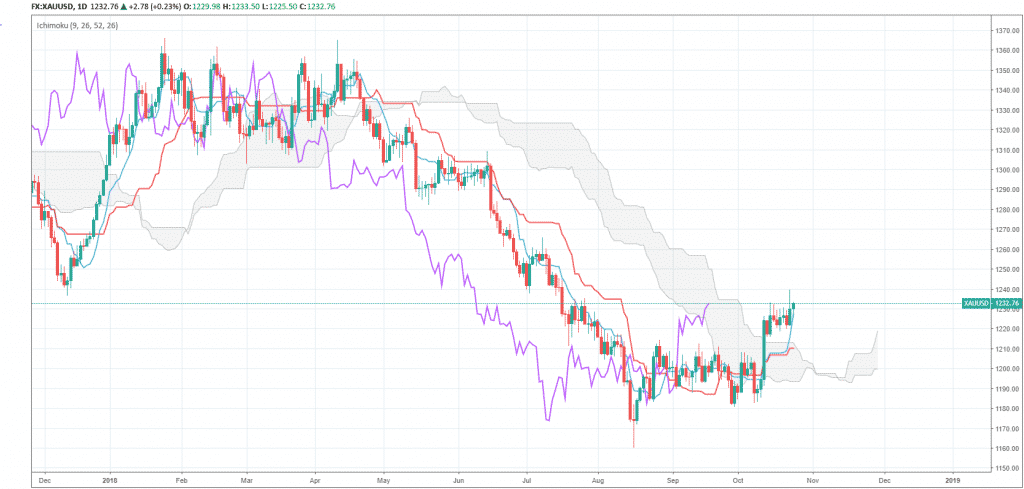
I’ve included some Ichimoku analysis below, as I believe it showcases the bullish flag pattern a bit clearer than the previous chart. The other reason is to recognise that although price action has managed to punch above the cloud suggesting little resistance, the lagging span (purple line) paints a more subtle story, one of quiet indecision as it sits within the cloud. This indicator spells a mixed bias from a directional perspective and leads me to believe we could be in for additional sideways moves longer-term.
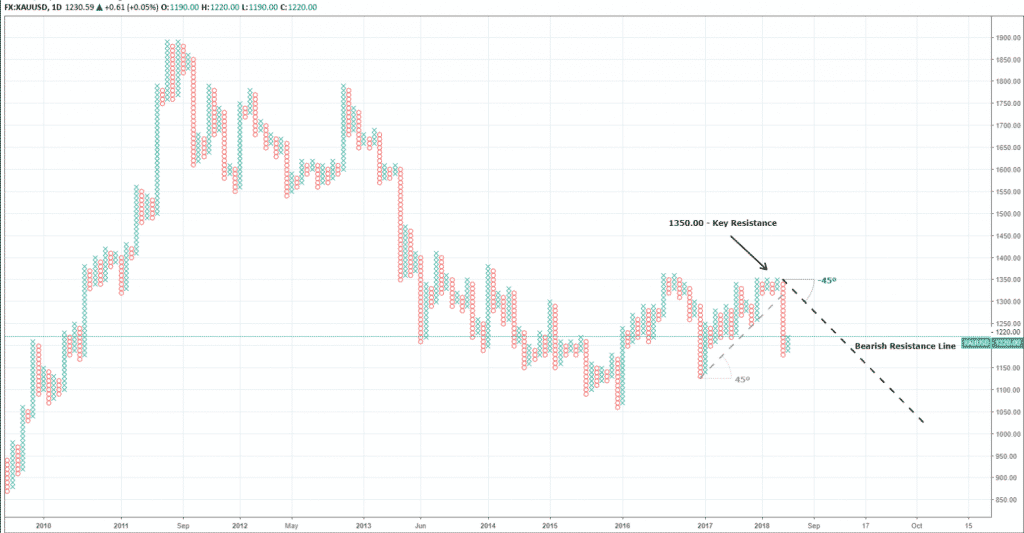
Depending on which chart you analyse, the general sideways theme is persistent in all of them. In similar fashion to how the Ichimoku chart best illustrated the bullish flag pattern, the point and figure chart below captures this overall sideways movement in my opinion.
Delving further, we find another potential clue for the recent bullish momentum. Notice the recent sell-off, there was a considerable increase in supply following a rejection of the key resistance area (triple top) at 1350.00 so what we may be witnessing here is the price attempting to consolidate.
So, do I believe stock market jitters are causing buyers to step back into gold as a potential flock to safety? In short, no. While there is undoubtedly a case for this type of activity, I think it’s too early to tell. I’ve also mentioned in previous articles that gold hasn’t been behaving as a traditional safe-haven asset of late. The technical picture is clear; the gold market is uncertain and somewhat confused as shown by the sideways tendencies. At this stage, only a convincing break above 1350.00 would give credit to a more substantial change in overall sentiment and another bullish run. For the time being at least, no doubt the meandering will continue, but overall I remain bearish on the precious metal in the medium to long-term.
By Adam Taylor
This article is written by a GO Markets Analyst and is based on their independent analysis. They remain fully responsible for the views expressed as well as any remaining error or omissions. Trading Forex and Derivatives carries a high level of risk. Sources: TradingView.com
Ready to start trading?
Disclaimer: Articles are from GO Markets analysts and contributors and are based on their independent analysis or personal experiences. Views, opinions or trading styles expressed are their own, and should not be taken as either representative of or shared by GO Markets. Advice, if any, is of a ‘general’ nature and not based on your personal objectives, financial situation or needs. Consider how appropriate the advice, if any, is to your objectives, financial situation and needs, before acting on the advice. If the advice relates to acquiring a particular financial product, you should obtain and consider the Product Disclosure Statement (PDS) and Financial Services Guide (FSG) for that product before making any decisions.
Next Article
Oil – Can Basic Economics Be Responsible For An 11% Decline?
On the back of what has been a pretty punishing month for Oil, now trading below $70 a barrel for WTI crude, we’re going to take a look at Oil, the fundamental drivers behind the price swings and what the future could hold for the Oil markets. For the sake of clarity, this article will be looking exclusively at WTI Crude. So what drove the clos...
October 25, 2018Read More >Previous Article
What to expect from the European Central Bank this Thursday?
The European Central Bank (ECB) is set to announce its interest rate policy this Thursday. Market participants are widely expecting the rate to r...
October 24, 2018Read More >


