
Gold slides as DXY recovers
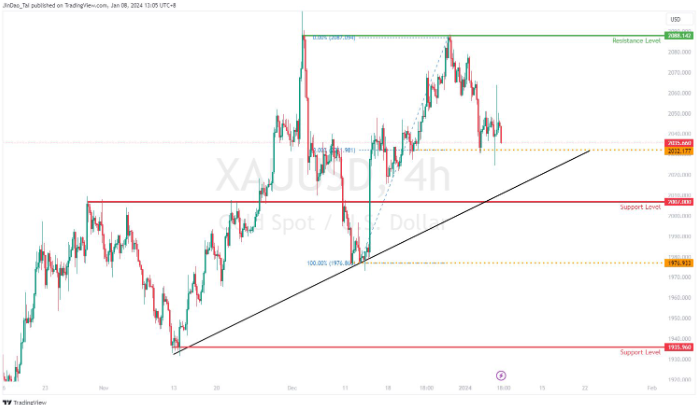
9 January 2024The recovery in strength on the DXY has led to Gold reversing strongly from the all-time high of 2088 which was reached at the end of 2023. Last week, the US employment data was released
stronger than expected with the Non-Farm employment change at 216K (Forecast: 168K), however, wage inflation remained unchanged at 0.4%. This set of data is likely to push back the anticipated timeline for potential Fed rate cuts, from March to May, which could see further upside potential for the DXY.
Gold is currently trading along the 2032 price level which coincides with the 50% Fibonacci retracement. If the DXY continues to climb, further downside can be expected for Gold. Look for the price to test the bullish trendline at the 2020 price level to signal further downside, with the next key support level at 2007.
Ready to start trading?
Disclaimer: Articles are from GO Markets analysts and contributors and are based on their independent analysis or personal experiences. Views, opinions or trading styles expressed are their own, and should not be taken as either representative of or shared by GO Markets. Advice, if any, is of a ‘general’ nature and not based on your personal objectives, financial situation or needs. Consider how appropriate the advice, if any, is to your objectives, financial situation and needs, before acting on the advice. If the advice relates to acquiring a particular financial product, you should obtain and consider the Product Disclosure Statement (PDS) and Financial Services Guide (FSG) for that product before making any decisions.
Next Article
AUD CPI Data Looms
Since the start of 2024, the AUDUSD has reversed from the resistance area of 0.6870, a high formed in June and July 2023. The main factor leading to the AUDUSD trading lower is primarily due to the recovery in strength of the DXY. The AUDUSD currently trades along the support area and round number level of 0.67. On Wednesday this week, the Aust...
Previous Article
Market Analysis – Oil tumbles on Saudi price cut – USD, JPY, CHF
USD ultimately ended lower on Monday with the US Dollar Index (DXY) first testing the resistance at 102.57 to the upside before reversing course to te...